
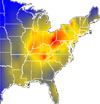
The above isopleth map depicts acid rain. Isopleth maps simplify data that have a continuous distribution. They are typically used for showing surface elevation, atmosphere pressure, and precipitation. A third dimension is included and is shown on the map as lines that connect points of equal value called isopleths.
No comments:
Post a Comment